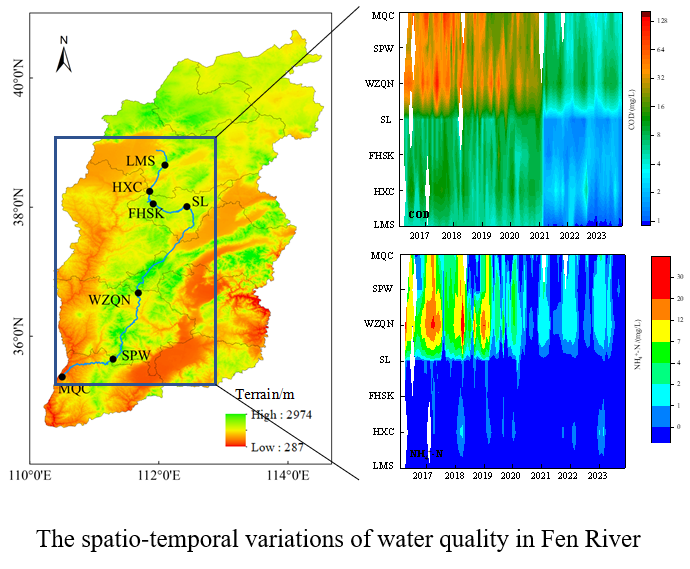
This study examined water quality trends in the Fen River Basin from 2016 to 2023, utilizing data from seven monitoring stations. Advanced statistical methods, including the Daniel trend test, Seasonal and Trend decomposition using Loess (STL), grey correlation analysis, and Long Short-Term Memory (LSTM) neural networks, were employed to identify trends and key influencing factors. Over this period, the average Chemical Oxygen Demand (COD) and Ammonia Nitrogen (NH₄⁺-N) concentrations across Fen River Basin were (25.3±17.3) mg·L⁻¹ and (3.6±3.2) mg·L⁻¹, respectively. Water quality improved significantly, transitioning from severe pollution in 2016 to mild pollution in 2023. The upstream consistently maintained higher quality, generally classified as Class I or II according to GB 3838-2002 standards, while the middle and lower reaches exhibited poorer conditions. The previously prevalent inferior Class V water quality has largely been eradicated. Key indicators such as COD and NH₄⁺-N in the middle and lower reaches demonstrated statistically significant improvements at a 95% confidence level. However, reductions in NH₄⁺-N concentrations were inconsistent in some upstream areas. These improvements are consistent with enhanced water source protection and stricter pollution control measures. Nonetheless, excessive pollutant discharge, particularly from domestic and industrial sources, continues to challenge the river's self-purification capacity, resulting in localized water quality fluctuations, which are most evident in the middle and lower reaches. Notably, a significant improvement in water quality was observed during the COVID-19 lockdown, attributed to reduced water usage across industrial, agricultural, and domestic sectors. This highlights the efficacy of emission reduction strategies and the potential for targeted management to achieve further gains. LSTM-based predictions suggest that COD concentrations in the middle and lower reaches will meet Class II surface water standards (15 mg/L) by the end of the 14th Five-Year Plan. However, NH₄⁺-N concentrations are projected to exceed the Class II limit (0.5 mg/L) during dry seasons. Future efforts should concentrate on mitigating seasonal NH₄⁺-N variations to sustain and enhance water quality improvements.