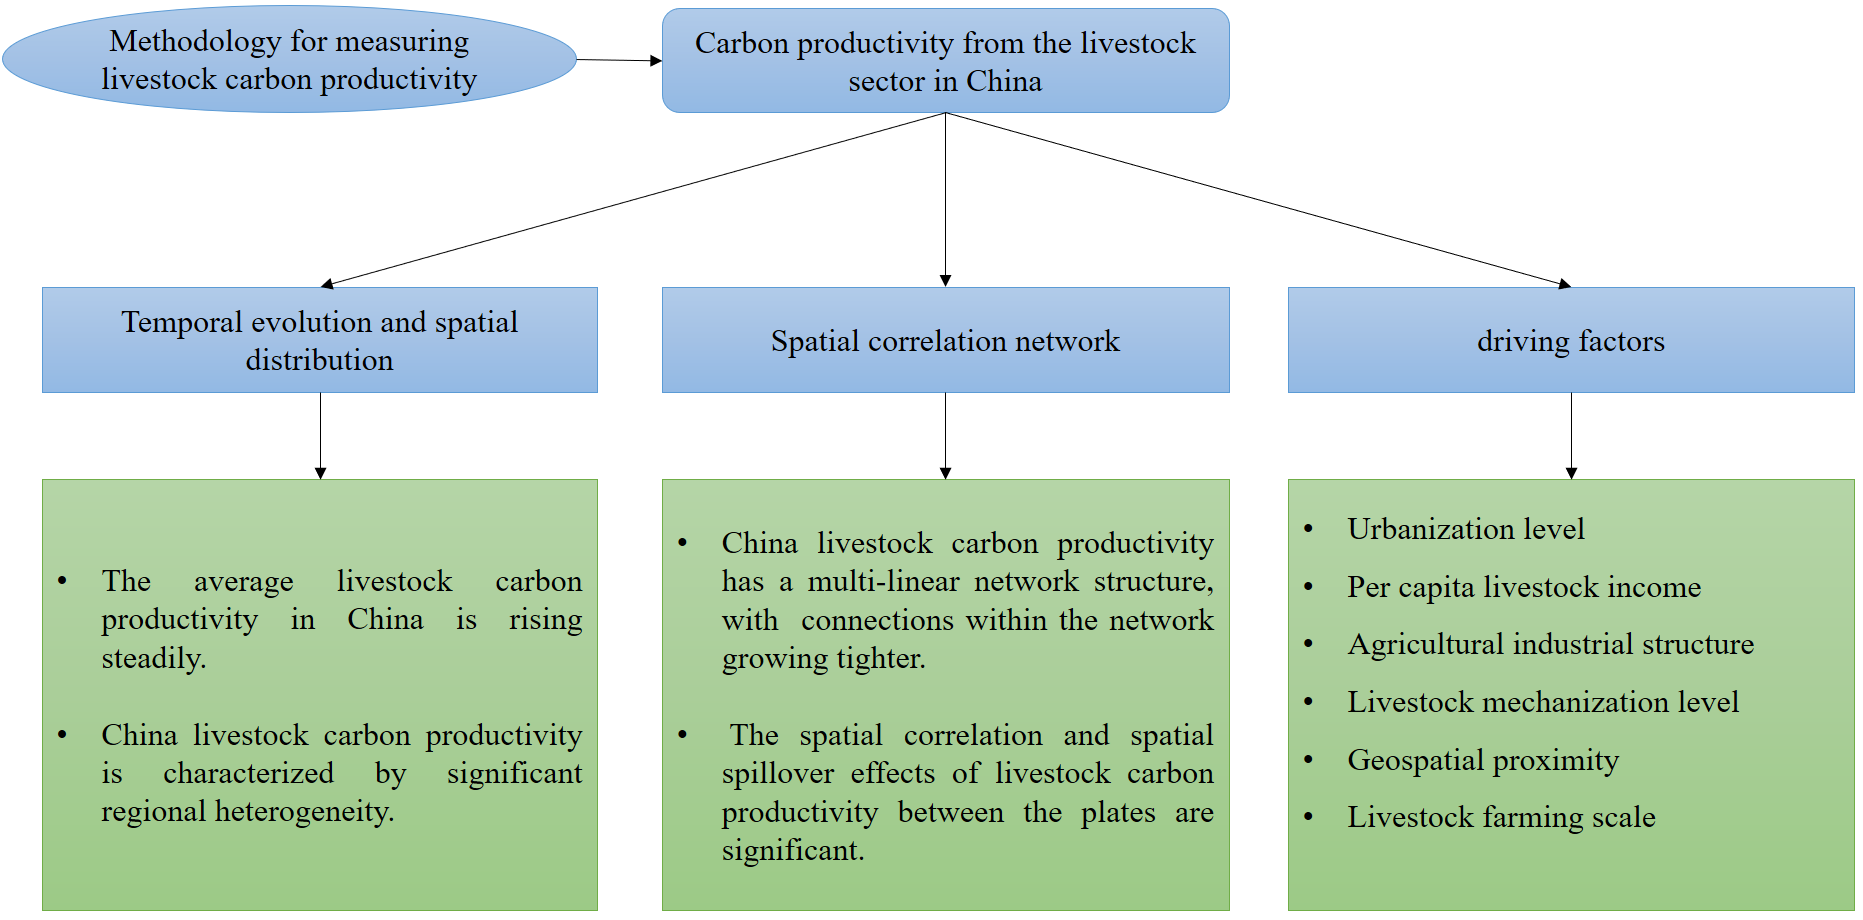
Exploring the spatial correlation network structure of provincial livestock carbon productivity and its driving factors can provide new policy perspectives for realizing the synergy of regional pollution and carbon reduction. This study constructs 2006-2021 panel data models by social network analysis (SNA) to systematically quantify the spatial correlation network structure of the carbon productivity in livestock sector. Then, the quadratic assignment procedure (QAP) is further utilized to examine its driving factors. The results demonstrate that: (1) The average carbon productivity from the livestock sector in China is rising steadily. (2) The spatial correlation of carbon productivity exhibits a multi-linear network structure, with the spatial correlation network becoming increasingly complex and the connections within the network growing tighter. It has formed a spatial network structure with the eastern coast zone as the core and the north-eastern and north-western zones as the edges. (3) The spatial correlation and spatial spillover effects of carbon productivity from the livestock sector between the plates are significant. (4) The formation and evolution of the spatial correlation network of carbon productivity from the livestock sector is influenced by the urbanization level, per capita livestock income, agricultural industrial structure and livestock mechanization level.
Total file downloads: 33