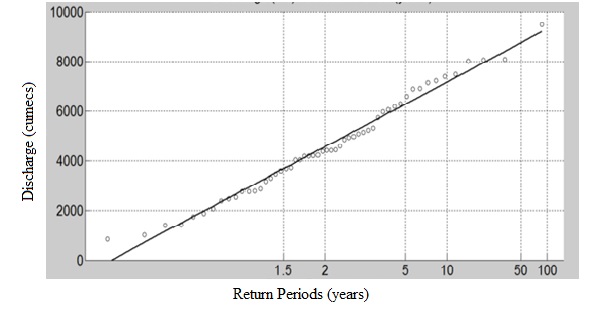
Estimation of annual peak flood flow has considerable financial influence, as this can pave numerous ways for water resources planning, design of hydraulic structures, and sustainable management of these valuable resources at an optimum benefit. Six standard plotting position methods coupled with Linear Log-regression Model (LLM) are employed for the Return Period (RP) of 15, 20, 25, 30, 60, and 1000 years to forecast peak flood flow magnitudes and for this daily annual peak flood flow data for the periods of 24 years were used to illustrate the proposed methods. Another method, Gumbel's Analytical Approach (GAA), is also used to forecast the peak flood flow magnitude for the same RP, and it was taken as the benchmark to compare all the six methods of plotting position. The degree of accuracy of the plotting position is based on the coefficient of determination R2. The R2 values for Adamowski, Hazen, Beard, Chegodajev, Tukey, and Benard, are 0.9073, 0.9284, 0.9119, 0.9111, 0.9135, and 0.9111, respectively. Out of the six-plotting position methods, Hazen method predicted a very closer value in comparison with GAA. It is advantageous to have the additional method to forecast peak flood flow for longer RP. The achieved result assuredly facilitates effective planning, regulation, and maintenance of huge reservoirs across the frequent occurrence of floods in river basin areas, considering safety and particularly downstream inhabited areas to save loss of human life, animals, damages to properties, and an impair of cultivated crops.
Total file downloads: 7