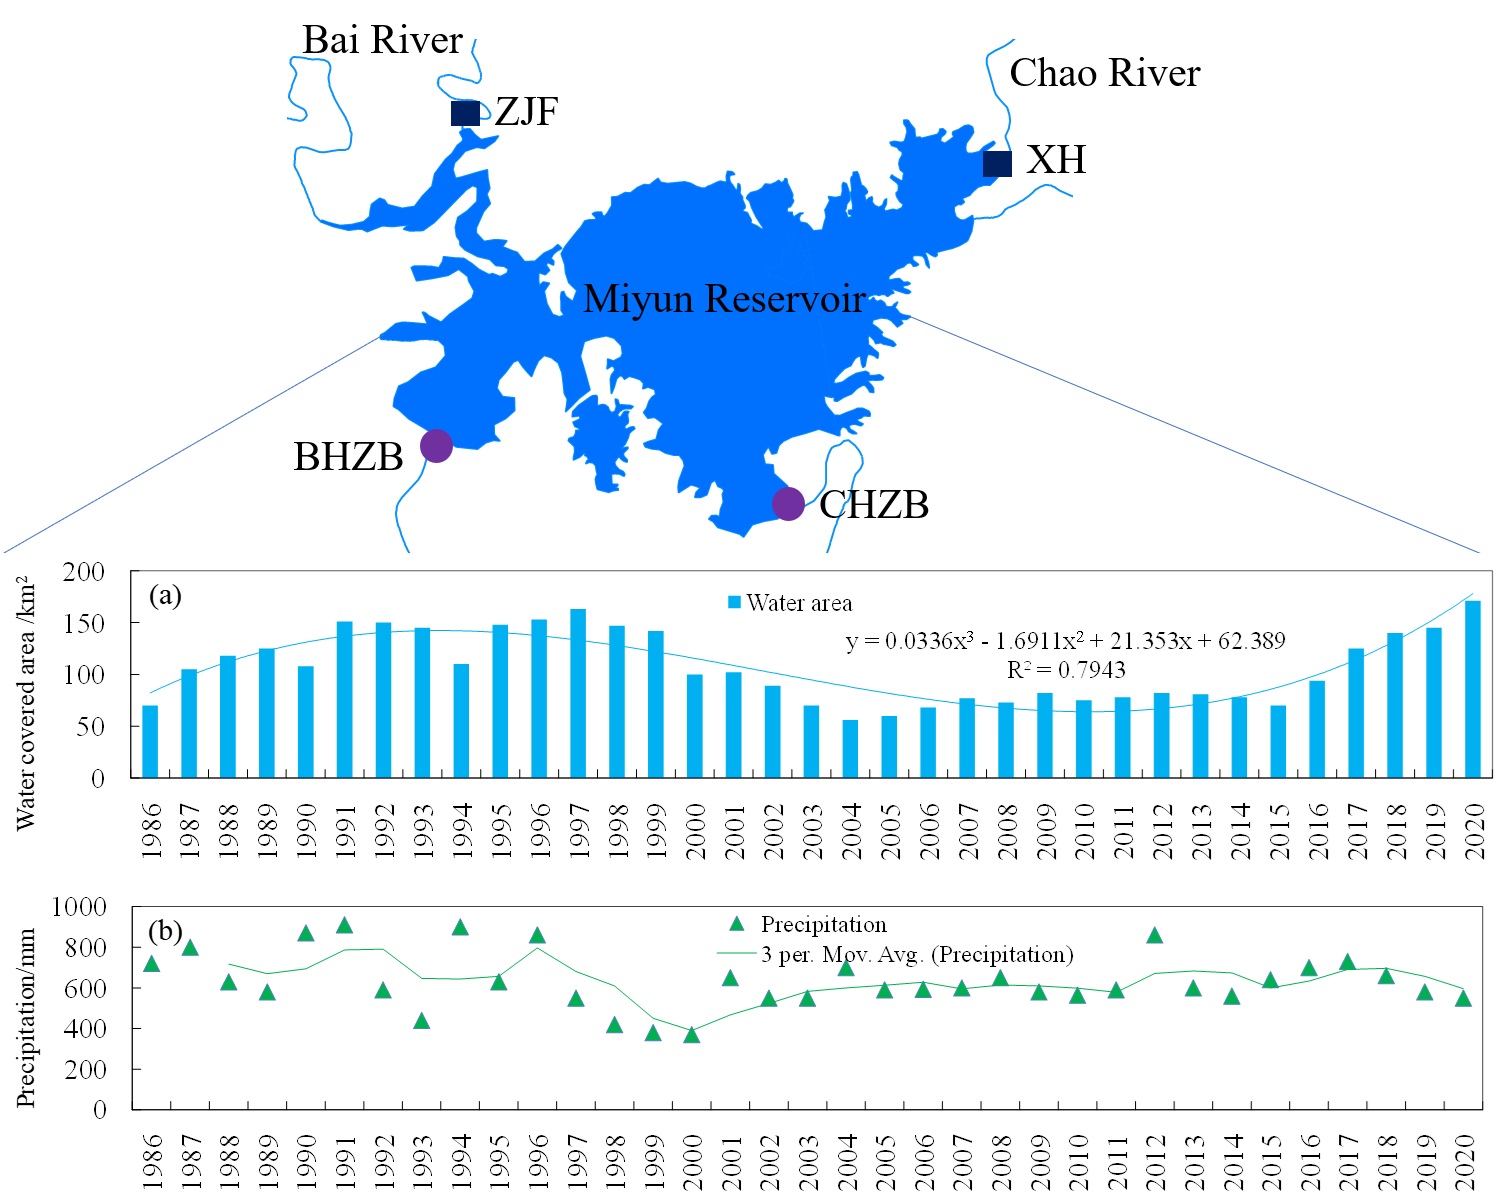
The total nitrogen (TN) is the key indicator for the eutrophication of Miyun Reservoir. Base on the long-term series of remote sensing, hydrological and water quality observation data, this paper comprehensively analyzed the trend of water quality especially the TN concentration and its influencing factors over 30 years in Miyun reservoir. The development trends of the TN concentration during the 14th Five Year Plan Period were predicate with the designed water quality scenarios simulations. The results showed that the water covered area of Miyun reservoir was reduced from 1986 to 2004 and enlarged from 2004 to 2020, and the smallest water covered area was about 56.4km2 in 2004 while the largest was about 170.7km2 in 2020. For the regional rainfall and artificial water storage, the inflow of Miyun reservoir is much greater than the water intake, and this is the main reason for the water covered area increased. From 1988 to 2020, TN contents in the inflow water of Chaohe river and Baihe river were generally in upward trends, with annual upward rates of 0.16 mg/L and 0.05 mg/L at the 99% confidence levels separately. However, the TN concentrations from Chaohe river and Baihe river presented downward trends for the recent 5 years. And this is own to the emission control and river ecological control measures in the upstream basin of Miyun reservoir. From 1988 to 2020, the annual averaged TN concentration of the main dams in Chaohe and Baihe (BHZB and CHZB) was 1.10±0.32 mg/L and 1.17±0.31 mg/L respectively and in recent 5 years, and significant positive trends were also identified at both two stations with the steadily rising the water level and volume in Miyun reservoir. The lightly increase of TN concentration in recent years in Miyun reservoir was the comprehensive results of external input and self purification capacity. Based on the MIKE21 model of four scenario simulations, the TN concentration of Miyun reservoir will meet the class Ⅱ water quality level (China’s Environmental Quality Standards for Surface Waters, GB3838-2002) under the comprehensive implementation of rural domestic source control and agricultural non-point emission control measures in the upstream basin of Miyun reservoir during the 14th Five Year Plan period.
Total file downloads: 11